Why does the humanitarian system need so much money?12 min read
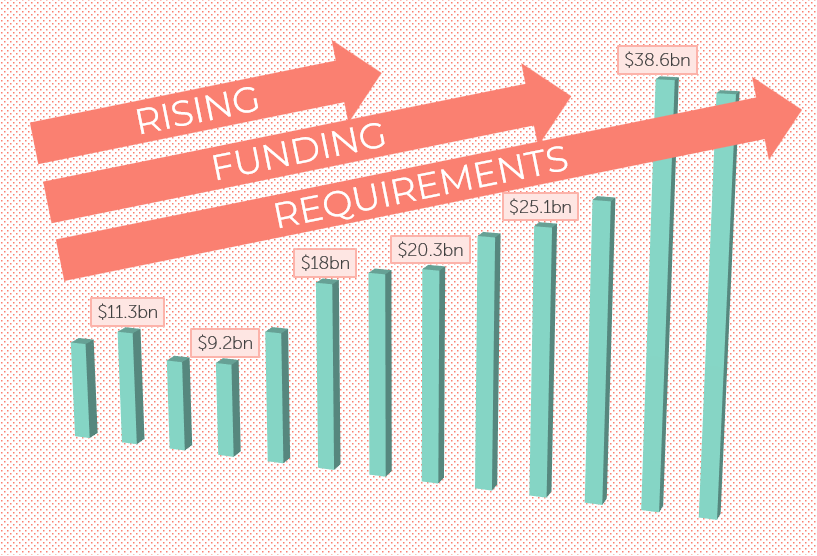
In 2022, the UN and humanitarian agencies appealed for a record $47 billion to meet the needs of the 183 million people. This equates to a staggering increase of 223% in funding needed in just the last five years. At the same time humanitarian aid has stalled, increasing the funding gap. What accounts for this massive increase in humanitarian needs? Is it just the case that the scale of humanitarian needs has exploded or is the nature of humanitarian assistance also changing? Funding and other data provides some clues and potential scenarios to answer this question.
One note before diving into the data: we are attempting to answer this question by testing hypotheses. Often the data below shows correlation, which does not necessarily imply causation. However, it’s very much ‘the best we have’ as we weren’t in the room where it happened in all the humanitarian contexts that constitute the $47bn required to meet humanitarian needs.
Hypothesis #1: Drivers of humanitarian need are the same as they always have been – conflict and displacement
Reducing human suffering caused by armed conflict is the origin of humanitarian action. Civilians face the brunt of violence and are forced from their homes, while wars can destroy societies. Almost three quarters of people in need of humanitarian assistance in 2021 were from countries experiencing high-intensity conflict. In 2021, 89.3 million individuals worldwide were forcibly displaced principally as the result of conflict.
The graph above shows the trend in funding required, the number of IDPs from conflict, and refugees under UNHCR’s mandate. There is a strong correlation between the rise in funding requirements and the increasing number of both IDPs and refugees. This suggests that conflict and displacement is still one of the principal drivers of humanitarian crisis and affected populations.
Hypothesis #2: Climate change is becoming an increasing cause of humanitarian needs
Climate change is undeniably the greatest global challenge. It exacerbates other humanitarian concerns such as food scarcity and produces climate-induced crises linked to extreme weather events. In 2021, half of all people in need of humanitarian assistance were living in countries with high levels of vulnerability to the impacts of climate change.
Some have suggested that the humanitarian system needs to pivot from war aid to climate aid. This might not be true though. The graphs above show a number of variables that indicate the frequency of climate related disasters, and the number of those affected by such disasters. Unlike the clear upward trend in funding requirements, none of these variables show a clear upward or downward trend in the last decade.
This suggests that the rising funding requirements are not directly due to the climate-specific disasters.
Hypothesis #3: It is all about rising food insecurity
Food assistance makes up the lion’s share of humanitarian appeals. Global hunger is at record levels and has been rising inexorably in recent years, with the war in Ukraine and supply chain problems providing additional shocks. According to the World Food Programme (WFP) the number of people facing acute food insecurity has soared – from 135 million to 345 million – since 2019. A total of 50 million people in 45 countries are at risk famine.
The number of people targeted for assistance overall in UN-led humanitarian appeals usually equates to those specifically requiring food assistance. As the funding requirements for the food sector go up it significantly affects to overall cost of humanitarian action.
And clearly, as the number of people experiencing food insecurity has risen in the past few years this trend has matched the rise in funding requirements.
However, it is important to see this in the round. In 2009, Food Security requirements accounted for 40% of appeals at the time of the financial crisis and shortly before the famines of 2011. However, in 2021, the sector accounted for 38% of appeals. In other words, the proportion of humanitarian appeals attributed to Food Security has stayed pretty constant.
A quick note: we can assume that the dip in the Food Security share of the overall requirement is due to the rise of ‘Multi-Sector’ as a separate catch-all bucket for refugee response. The use of this categorisation of funding declined substantially in 2021, thus providing greater visibility to the Food Security requirement again.
We know that the number of people experiencing food insecurity has increased substantially, but as a proportion of the overall requirements it’s roughly the same as a decade ago, so what’s going on? Our analysis hints that (a) the huge increase in food insecurity is reflective of all humanitarian needs growing, and (b) increasing food security doesn’t appear to be responsible for the overall rise in humanitarian funding requirements.
The counter argument here is that food insecurity has not grown disproportionately because food security drives crisis, and within those crises, other humanitarian needs present themselves, thus food security is the flood that lifts all boats.
Hypothesis #4: Humanitarian assistance is being increasingly used to fund poverty alleviation
Slow global economic growth resulting from the COVID-19 pandemic, the war in Ukraine, and other shocks are reversing historic improvements in poverty alleviation in proceeding years and the achievement of the Sustainable Development Goals. Is there a risk that humanitarian funding is being used for poverty alleviation rather than addressing more typical humanitarian challenges?
As the graph below shows, improving poverty levels are negatively correlated with rising funding requirements for humanitarian action, suggesting that at a global level there isn’t this substitution effect between humanitarian and development. Things are getting better on the whole in terms of global poverty, but at the same time, things are getting worse in a smaller number of humanitarian contexts. And when we look at actual funding for humanitarian and development activities, it’s quite clear that development assistance still takes in most funding.
So at a global level it doesn’t appear that the hypothesis checks out. But what about at a country level? We’ve separated out 20 contexts that regularly have humanitarian appeals, and those that don’t. Amongst those that don’t, humanitarian funding as a proportion of total humanitarian-development funding is relatively stable at 6-8%, suggesting there isn’t a substitution effect in non-humanitarian contexts.
Amongst countries with regular humanitarian appeals, we can see that humanitarian funding has increasingly taken up a higher percentage of all humanitarian-development funding (starting at 15% in 2007 and climbing to 43% in 2019). If anything this would suggest there is drain on development assistance towards humanitarian funding in these contexts – not the other way around.
And even then, when you take into account that a huge amount of this is Syria and Yemen, it looks somewhat different. The graph on the right shows the average percentage across the same contexts (not the total value as per the first graph). This shows that the percentage across these contexts that had a funding requirement in any given year was relatively stable at just over 30%.
If we were to see a substitution effect we might at least expect a growing percentage of humanitarian assistance as a percentage of all ODA. But we don’t see that as the 30% is quite stable over time, and the growth in the humanitarian component across the whole sector is largely due to the humanitarian contexts of Syria and Yemen.
All of this suggests that humanitarian funding isn’t being used for traditional development activities – or if it is then the signal is so weak as to not see it in this data. The counterargument is that the 20 contexts are actually development contexts and use of humanitarian funds in these contexts are scope creep, but that’s a value judgment on the individual contexts. Check out the Sources and References section for the full list of contexts included in this bucket.
This all being said, there are an increasing number of countries such as Lebanon, Zimbabwe and most recently Sri Lanka where humanitarian appeals have been developed for humanitarian needs resulting from economic crisis rather than armed conflict or natural disasters. Whilst these account for a small amount of all requirements, it is notable that this appears to be a growing trend.
Hypothesis #5: Crises are more protracted
Humanitarian crises are becoming longer and more protracted. The 36 countries experiencing protracted crisis in 2021 accounted for 74% of total people in need. The graphs below show that the proportion of all humanitarian funding that is required for protracted crises is increasing.
This drives up the accumulative cost of humanitarian assistance. The graph on the right clearly shows how the amount needed for non-protracted crises has declined from $14bn in 2014, to $6bn in 2021, but the amount needed for protracted crises has risen from $6bn to $32bn in the same period.
The protracted nature of crises has led to more long-term forms of assistance which are more costly and also increasing. For example, a recent report concluded that the proportion of funding requirements for the education sector has increased from less than 2% in 2012 to 5.2% in 2021.
If we want to understand how this radical shift in the sector happened in the last 8 years, we need to look at individual contexts. The graph below shows how a small number of contexts constitute such a huge amount of the funding requirement.
Syria and the wider Syria regional response make up $10bn of the funding requirement alone in 2021. Yemen reached nearly $4bn, Ethiopia rose above $2bn, and Sudan and the DRC nearly reached $2bn.
Hypothesis #6: COVID-19 had an effect on the escalating funding requirements
Funding requirements stood at $28bn in the year before COVID-19, and ballooned to $39bn in 2020, only to increase again to $47bn in 2022. This huge increase in just a few years might lead us to think that COVID had a one-off but permanent uplift to funding requirements.
However, that’s not what we’ve found.
If we look at the long term growth rate in funding requirements, we can see that it’s been pretty stable for the past 15 years at 13%. This figure is the annual growth rate year-on-year if we compare the sector over a 5-year period. In other words, in the year of COVID-19, the sectoral requirements grew at an average rate of 14.7% every year for the previous 5 years.
The graph is pretty clear. If COVID-19 had a huge effect, we would expect the growth rate in 2020 to be high compared to the average. But the average across the past 15 years was 13%, so the year of COVID and the years afterwards fit on that trend almost precisely. If we remove 2020-22 from our calculations and just look at the average growth rate between 2007 and 2019, the average is still 13%.
Therefore, it doesn’t look like COVID-19 had a huge effect. 2020 was just a continuation of a long-term trend. Whether this long-term trend can continue at 13% is questionable though, as it implies that funding requirements will hit $100bn by 2029.
So which hypothesis fits most?
There are multiple factors that have been driving up humanitarian needs so significantly in the last few years, although some more important than others. Armed conflict and displacement appear to remain the main cause of humanitarian need and funding requirements, while at least for the moment, climate change doesn’t appear to be having a dramatic direct impact. Rising food insecurity is of major concern but proportionately about the same as it has historically been within humanitarian action.
The increasingly protracted nature of humanitarian crises are also proving costly and clearly also driving humanitarian needs and funding requirements. It is unclear whether humanitarian action is being used as a substitute for poverty alleviation, but it seems that any potential substitution effect is relatively small. The launching of appeals in non-conflict contexts based on political and economic crisis is a sign of ‘mission creep’ for the humanitarian system but given the relatively small size of these appeals it is unlikely to be driving up the overall cost of humanitarian action.
Clearly, more research is required on the drivers of humanitarian requirements. We’ve tried to highlight here the importance of looking at what the data tells us. While the Global Humanitarian Overview (GHO) is extremely comprehensive it arguably lacks this kind of analysis which makes an important contribution to understanding the drivers of humanitarian needs. This is not just an academic question but one with real life operational consequences to target the finite amount humanitarian funding where it is needed most.
Sources and References
Data sources for graphs
Climate-related disasters (number of, and number affected by) – taken from EM-DAT: The International Disaster Database. Retrieved on 23rd May 2022. Includes disasters that are classified as climatological (drought, glacial lake outburst, wildfire), hydrological (i.e. flood, landslide, wave action), and meteorological (i.e. extreme temperature, fog, storm).
Food security – taken from Global Report on Food Crises 2017, 2018, 2019, 2020, 2021, and 2022. The underlying data before normalisation reflects the number of people who are food-insecure and in crisis. This equates to IPC/CH Phase 3 or above.
Funding requirements – data from UN OCHA’s Financial Tracking Service (FTS). Retrieved on 23rd May 2022. Funding requirements for specific sectors between 2007 and 2021 (as seen in Hypothesis 3) was extracted from FTS on 13th July 2022.
Official development assistance funding and humanitarian funding – data from OECD Creditor Reporting System (CRS). Includes ODA grants, ODA loans, and equity investment. Excludes other official flows and private development finance. Humanitarian funding is a sum of sector codes 720, 730, and 740. Value of funding is “USD disbursement” based on constant prices. Contexts that regularly have humanitarian funding requirements are those that had a requirement at least half of the years between 2003 to 2020, namely: Afghanistan, Burundi, Burkina Faso, Central African Republic, Chad, Congo (Dem. Rep.), Djibouti, Haiti, Iraq, Korea (Dem. People’s Rep.), Mali, Myanmar, Niger, Palestine, Somalia, South Sudan, Sudan, Syria, Yemen, and Zimbabwe.
Internal displacement (conflict and natural disasters) – data from Internal Displacement Monitoring Centre. Retrieved on 23rd May 2022.
Protracted crises – data from UN OCHA’s Financial Tracking Service (FTS). Retrieved on 13th July 2022. A protracted crisis is defined here as any country “with at least five consecutive years of UN-coordinated humanitarian or refugee response plans as of the year of analysis”. This is taken from the Development Initiatives definition of protracted crisis, as noted here in Notes #2, in order to align with existing analysis. It is important to note that in the “Response Plans Value of Overall Humanitarian Funding Requirement Graph”, and indeed all graphs, the crisis is only defined as protracted on the fifth year of consecutive plans. This is why the Regional Syria plan only appears as protracted from 2017, and not from 2013 when the first Syria regional refugee response was launched.
Refugees under the UNHCR mandate (number of) – data from UNHCR Refugee Statistics. Retrieved on 23rd May 2022.
References:
Development Initiatives (2022). Global Humanitarian Assistance Report 2022. Retrieved from here.
Geneva Global Hub for Education in Emergencies (2022). Financing for education in emergencies coming up short in the wake of COVID-19. Retrieved from here
The New Humanitarian (2021). It’s time to pivot from war aid to climate aid. Retrieved from here.
UNHCR (2021). Global Trends Report. Retrieved from here.
World Food Programme. A Global Food Crisis. Retrieved from here.