Prioritisation is driving a lower funding requirement7 min read
Just before the start of each calendar year, the global scale of humanitarian needs and response is summarised in the Global Humanitarian Overview (GHO). And each year this comes with a price tag.
But for the first time in the past decade, the cost of meeting humanitarian needs has fallen in this yearly snapshot. The 2023 GHO needed a staggering $51.5bn at the time of publishing (eventually rising to $56.7bn throughout the year). However, somewhat against trend, the 2024 GHO ‘only’ needs $46.4bn.
So what’s going on here? We’re forever told that humanitarian needs are ever increasing, and when you look at the global picture it’s hard to argue with that.
Then why has the cost of meeting those needs decreased by $10bn on the 2023 funding requirement, or by $5bn on the 2023 ‘start-of-year’ figure?
Could discontinued plans contribute to the decrease in the funding requirement?
Yes, but only to an extent. As per any year, there are a number of Flash Appeals that respond in the short-term to emergencies, and are not often continued into the next year.
Ten plans, six of them being Flash Appeals, won’t continue into 2024. The other four plans include one HRP that won’t continue, the Burundi HRP, as well as ‘other’ plans, such as the Lebanon Emergency Response Plan.
But it is quite striking that 10 plans have been discontinued, but the effect of losing these 10 plans is that they reduce the funding requirement by just over $4bn, so not that much. The average funding requirement last year was about $1.3bn, and yet the average across the discontinued plans was $0.4bn.
If that’s not the full story, what accounts the other part of the decrease?
There are a few things that could be influencing factors.
Firstly, there could be a change in the number of ‘People in Need’ (PIN), and the GHO makes this argument. The GHO points to several contexts such as Afghanistan (where a degree of stability has reduced needs), and Mali (where needs are now in the ‘development’ bucket) which have reduced the number of people in need. Comparing the initially published 2023 and 2024 GHOs, the PIN has decreased from 339 million to 299 million, a reduction of 40 million.
Secondly, it could be a change in the percentage of people in need actually being targeted by humanitarian agencies. The GHO again makes the point that in “Central African Republic and Nigeria humanitarian assistance will provide a more concentrated and focused response”, whilst in Honduras, “focus is placed on areas of higher severity”. The percentage targeted in these contexts has declined (e.g. from 72% to 56% in Nigeria, from 66% to 46% in Honduras).
But at the same time, there may be other factors pushing the funding requirement upwards, despite it declining overall.
For example, changes in the cost of reaching one person has actually increased globally. Last year, the GHO needed $51.5bn to begin with, targeting 230m people, working out at $224 per person. Whilst this year, the equivalent figure is $265 per person. This increases costs, and yet the overall requirement has decreased.
We need to disentangle these different factors to work out how they affected the funding requirement. They’re all likely to play a part in the change, but the question is: to what extent? And in which direction?
Targeting fewer people in need is the critical driver
We’ll go into the methodology below, but before we do the headline is clear: changes in the percentage targeted is driving a lower funding requirement. Simply, contexts are prioritising to a greater extent who they’re targeting.
The graph below shows how each factor has affected the overall funding requirement. Prioritisation (lower percentage of PIN targeted) has decreased the overall requirement by $11.7bn. The median context in 2023 targeted 72% of all people in need. In 2024, the median context targeted 65% of those in need.
Changes to Yemen, Somalia, Sudan and Syria all contribute significantly to this downward pressure. But it’s the regional Syria plan that really drives things. Whilst it used to target 100% of those in need, it now only targets 58%, at pretty much the same cost.
Non-renewed appeals come in as the second largest factor driving down the requirement, followed by changes in the number of people in need.
The number of people in need has decreased across quite a few contexts. In Ethiopia, the PIN number has decreased by 8.6 million people, whilst in Afghanistan, it has decreased by nearly 6 million. Elsewhere, the Ukraine HRP had 2.6 million less in need, whilst its regional response had 1.8 million less in need. Yemen as well saw a decrease of 3.4 million people in need… Of course, this needs to be seen in the wider picture where 78 million people are still in need across these five plans.
Cost increases, however, have pushed up the funding requirement. For example, the regional Syria plan now requires $560 per person instead of $434 per person last year. There have also been cost increases in Africa (Chad: $178 to $257 per person in 2024; DRC: $225 to $299; and Sudan: $141 to 184) and Central Asia ($151 to $175). Together, changes in the the cost of reaching a person in need has contributed to $5.9bn more being needed in 2024.
There are then two other smaller factors that play a part, but we’re not quite able to explain. Our ‘intercept’ component is the ‘all other things being equal’ factor of our analysis. Essentially, if all the other changes hadn’t happened (cost changes, prioritisation, discontinued appeals), we would have expected an increase of $1.9bn globally.
And then there’s ‘unknown’ – this is the part we can’t explain using our analysis, but other factors have increased the requirement by $2.8bn.
Is prioritisation now a necessity?
The decline in funding requirement is a function of different factors applying both upward and downward pressure. The main upward pressures are increases in cost per person across the different interagency plans, with the ‘all else being equal’ and ‘other unknown’ factors playing a smaller role.
However, these upward pressures are far outweighed by the downward pressures, namely prioritisation, the removal of certain interagency plans from the mix, and a reduction in the number of people in need in some contexts.
The runaway funding requirement has been a subject of conversation for quite a while, and there have been significant questions about how sustainable this is. Can the humanitarian system keep asking for more and more money if donors aren’t willing to fund it?
If costs are increasing (note the increase from $224 per person in 2023 to $265 per person in 2024), there’s going to be more and more pressure to prioritise. And we can see this from individual plans last year. There were only 5 plans where the percentage targeted went up substantially, compared to 30 contexts where this percentage either stayed stable or declined.
So prioritisation is now becoming standard practice to keep costs in check. But consider the alternative scenario: what if the humanitarian system didn’t change the percentage it targeted in 2024? The overall funding requirement would have increased.
Does this matter?
Globally, 68% of those in need were targeted in the 2023 GHO when it was published. But in 2024, only 60% were targeted.
And therein lies the fundamental quandry: should we keep consistency over time and show how the funding needed really is increasing if we target the same percentage of people? Or should we adjust the parameters in who to prioritise so that we don’t ask for a huge amount of funding?
Methodology and Sources
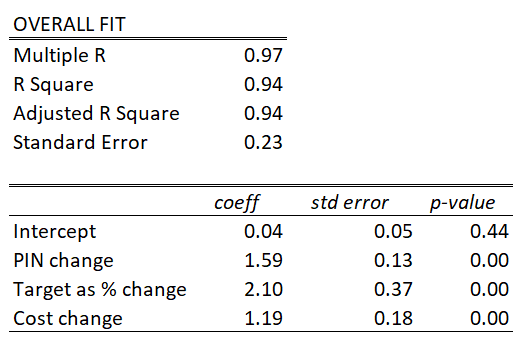
To get the figures for the last graph, we used a method here called multiple linear regression. This is likely familiar to graduates of the social sciences, but to those of you not au fait with the method, here’s a quick explainer.
We are looking at factors (dependent variables) that affect the change in funding requirement (independent variable). We created a dataset looking at the independent variable (change in requirement), and dependent variables (change in PIN, change in target as a percentage of the PIN, and change in cost) across all plans that exist in 2023 and 2024.
We then used multiple linear regression to determine to what extent each of these factors plays a role. We’re looking to see if each of these factors is ‘statistically significant’ (p <0.05), which they all are.
We can also see to what extent these factors explain the variation in the change in funding requirement (the R2), which happens to be 94%.
At the end of the process, we can put together a formula which is something like this:
Change in funding requirement = intercept + (change in PIN * 1.59) + (change in target as a % * 2.10) + (change in cost * 1.19)
We can then plug into this formula the numbers from each individual plan and work out to what extent each factor influences thing at the individual plan level. We then aggregate this, and are able to produce the graph that you see above.