Are Pooled Funds a Driver of Localisation?8 min read
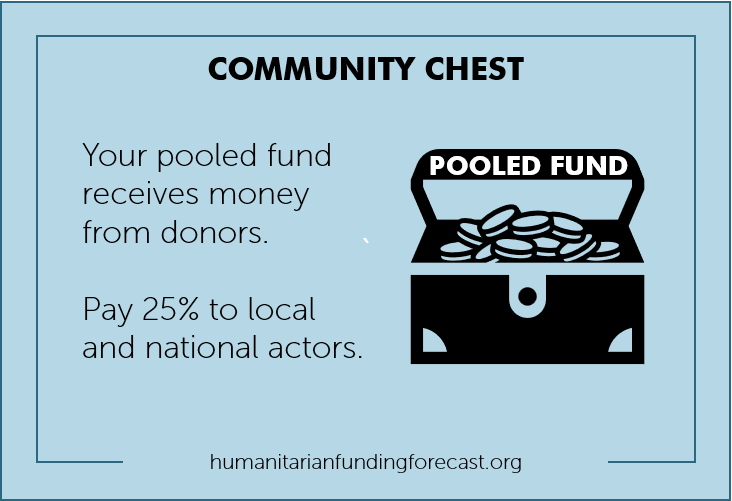
How can local and national actors access more funding? A quick (and always necessary) reminder: donors made commitments in the 2016 Grand Bargain to get at least 25% of funding to local and national actors. There’s a whole range of reasons why this is important. As the Localisation in Practice paper sets out, there are three categories of reasons. There’s the financial argument – implementation by local and national actors is cheaper. There’s the principled argument – to address an unbalanced and unhealthy power dynamic between national and international actors. And there’s the strategic argument – localisaation ensures sustainability as local and national actors are often the first responders in terms of crisis, and will continue to be in the community regardless of the presence of international actors.
But often donors are unwilling to give directly to local and national actors due to their own ‘risk appetites’, so the money goes to international actors instead, such as UN agencies and international NGOs.
The 2021 Grand Bargain Annual Independent Report notes that “many donors see pooled funds, particularly the OCHA-managed [country based pooled funds], as a way to navigate their own legal, administrative, capacity and political constraints in order to get more of their money to local actors more directly”. But can country based pooled funds (CBPFs) play a vital role in allowing donors to meet their localisation commitments (as well as other Grand Bargain commitments such as those on flexible funding)? The answer is yes, but it’s not always the case. The trend is moving in the right direction. But underneath the surface, many CBPFs don’t come with the promise of localisation.
We’ll be talking about country based pooled funds in this story, which are just pots that donors put money into that OCHA then distributes in a given country. And we’ll be referring to funding given directly to local and national actors, as opposed to indirect funding.
This is not to say that indirect funding doesn’t matter. But the Grand Bargain did promote direct funding. And indirect funding can continue to promote the dynamics of the existing system that don’t promote localisation (sub-granting and not principled partnerships, no capacity building funding for national actors, not fixing the system so that national actors are actually eligible for direct funding, and so on).
Globally, things are moving in the right direction
Let’s look at the big picture: things are moving in the right direction. Available data from OCHA’s CBPF Data Hub shows that local and national actors (henceforth, “national actors”, or L/NA) received 18% of direct funding from CBPFs in 2016. But by 2021, this had increased to 27%.
This has mainly been at the expense of UN agencies as their share has decreased at the same time. In fact, by 2021, a massive milestone was reached: national actors received more than UN agencies for the first time ever.
This is the ‘glass half full’ story. The trend is positive. Across all CBPFs, they are now giving more than 25% directly to national actors.
But not all contexts mirror this dynamic
If we look at the number of contexts giving more than 25% directly to national actors over time, there isn’t any clear trend. Every year (except one) just over half of CBPFs don’t give meet the 25% threshold. And in only one year did the majority of CBPFs meet the threshold: 2018.
So if more CBPFs aren’t meeting the threshold, but the percentage across all CBPFs has gone up, what’s happening? To answer this we need to look at which contexts meet the 25% threshold.
As the graph below shows, there are only a few CBPFs that contribute significantly to the 27% figure we see in 2021. They are: the Syria cross-border, Somalia, Yemen, and DRC funds. Funding to national actors in these four contexts make up 64% of the total national actor allocations in 2021 across all CBPFs.
Of the contexts not reaching the 25% in 2021, it is also noticeable that none of those (apart from South Sudan) have a funding allocation of over $10m to national actors.
The four types of CBPFs
Breaking this down even further, we can see there are four types of CBPFs when it comes to how much they give to national actors.
Type 1 funds are those that are below the 25% target, and don’t seem to be moving towards the 25% anytime soon. So why? It’s hard to know without doing a deep dive into those contexts, but a look at the contexts under Type 1 might suggest that there is a real or perceived difficulty in giving directly to national actors due to the operating environment.
Type 2 funds are those that are consistently above the 25%. These are the leaders when it come to localising funding from CBPFs. The question, again, is why? Let’s brainstorm a few ideas. You could make the argument that the real or perceived risk is lower in these contexts, and the operating environment is more conducive. You could also make the argument that civil society capacity is greater in these contexts.
Type 3 funds are those that have improved significantly in recent years. These contexts are DRC, Nigeria, and Somalia. Why have these improved in recent years? We don’t know – not without doing a deep dive into it. But it does look like there has been a sustained effort in these contexts at improving localisation of funding.
Type 4 funds are those without rhyme nor reason. There doesn’t appear to be a trend, and they tend to fluctuate and bounce around. Sometimes they’re above, and sometimes they’re below the 25%.
Even despite these variations, CBPFs are doing better than all humanitarian funding
When we look at the Financial Tracking Service (FTS) for all humanitarian funding, we can see that only 1.7% of funding is going directly to national actors (and a substantial amount of that will be pooled funds doing the heavy lifting).
Compare this to the 27% of overall CBPF funding going to national actors in 2021, or even the CBPF which did worst in 2021 on localisation of funding (i.e. CAR) with 4.5% going to national actors. We can see that pooled funds are doing better than all humanitarian funding.
There is the caveat that not all ‘tiers’ of funding are shown on FTS, in other words it doesn’t show sub-granting. The real number will be higher than 1.7%. But yet, we can’t deny CBPFs are doing a good job on the whole.
Some final thoughts
Thought #1: Pooled funds can be a recipe for success in localising funding. Type 2 and type 3 funds show this. But there are also some CBPFs that aren’t a vehicle for localisation. We should be prioritising attention and efforts on type 2 and 3 funds and ensuring that we get the learnings from what worked for those that have improved in recent years. And those are learnings not just in terms of barriers, but also the actual actions that need to be taken and invested in to improve things.
Thought #2: The arc of history is not inevitable. If we look at the first graph it looks like the percentage going to national actors is increasing over time. But these are fragile gains built mainly on the backs of just four CBPFs. Some funds are regressing, and some have no clear trend. It takes time, effort, action and political will to transform funding. And if these aren’t actually applied to the CBPFs then there’s no reason why they can’t regress.
Thought #3: We need to understand why some contexts are successful, and why some are not. Is it the risk appetite of the fund managers, a lack of civil society capacity, the operating environment creating constraints? And if it is these factors, are they real, or are they perceived? Are there ways to operate that allow any risks to mitigated?
Whilst we don’t necessarily have the answers on how to transform things, we wanted to show that CBPFs as a whole are doing a good job on the localisation front, but there is a lot of potential to do a huge amount more.
Methodology and Sources
Why don’t the graphs showing the paths of CBPFs over time include all years? It’s an excellent question. The simple answer is that we don’t have the data. That’s why the graphs are broken at different points. We determine the start year of funding allocations by looking at the CBPF Data Hub “Allocations by Organisation Type” chart and seeing which years a CBPF is giving funding allocations. For example, Somalia goes back to 2010 according to the Data Hub, and so 2010 is Somalia’s ‘Year 1’. Afghanistan starts in 2014, so 2014 is Afghanistan’s ‘Year 1’. But we are not able to get data for any year before 2013 as we are taking the data from the “Allocation Flow” chart in order to get the numbers for ‘direct’ funding. This is why the lines don’t necessarily show all years, even though we know that funding allocations were made in certain years where we don’t have data for ‘direct funding’.
Data Source: All data (apart from that in the ‘Even despite’ section) comes from OCHA’s Country Based Pooled Fund Data Hub. Data was extracted on the 11th February 2022.
Scope: As noted above, the data looks at country based pooled funds. This also includes the one ‘regionally hosted pooled fund’ in Niger in 2021. The data also only examines direct funding allocations to local and national actors.
More Reading #1: Featherstone and Mowjee (2020). Desk Review on Enhancing the Potential of Pooled Funds for Localisation. Retrieved from: https://gblocalisation.ifrc.org/wp-content/uploads/2020/12/FINAL-GBW2-pooled-funding-for-localisation.pdf
More Reading #2: Grand Bargain Annual Independent Report 2021. Metcalfe-Hough, Fenton, Willitts-King, and Spencer (2021). The Grand Bargain at five years: an independent review. Retrieved from: https://odi.org/en/publications/the-grand-bargain-at-five-years-an-independent-review/
More Reading #3: Localisation in practice: emerging indicators and practical recommendations (2018). Retrieved from: https://reliefweb.int/report/world/localisation-practice-emerging-indicators-and-practical-recommendations