Do more severe humanitarian crises get more money?6 min read
Humanitarian funding is an exercise in prioritisation by donors. Donors have a pot of money in their budgets that they need to distribute to different places, and they have to ask the question: where will this money make the most impact? Of course there are other considerations (e.g. national interests of governments), but for today we’ll set those aside.
One obvious way to answer the basic question about where will money deliver impact is to look at how severe a humanitarian crisis is. One measure of “severity” of humanitarian crises is the INFORM Severity Index, published by ACAPS. This takes into account (a) the impact of crises, (b) the conditions of those affected, and (c) the complexity of the crisis. The INFORM Severity Index is a comprehensive view of severity of different crises and we’ll be using this index in the analysis below.
So if a humanitarian crisis is more severe and there are more “needs” in a certain place, then you might have thought that would lead to more funding. But does it?
The answer is…it depends.
Is higher severity associated with more funding?
The short answer is: yes. The longer answer is also yes, but there’s not a linear relationship between the two.
As we can see from the graph below, any humanitarian crisis in 2021 with a severity less than 3 (on a 1-5 scale) did not get huge amounts of funding (the highest being Madagascar with $160m). As we start to get into “high” severity contexts (between 3 and 4), we can see more contexts receiving more than $100m. The closer we get to the threshold of 4, more countries appear to receive more funding.
And then between 4 and 5 is where we can really visibly see the relationship between the two variables. For “very high” severity contexts, huge amounts of funding are possible. In other words, it looks like donors really prioritise giving more funding to “very high” severity contexts, which seems like a good exercise in prioritisation.
For example, we can see that the three contexts with the highest severity rating in 2021 (Yemen, Syria and Afghanistan) all received at least $2bn in 2021.
However, there are a couple of caveats. We can see that the relationship between severity and funding doesn’t always play out in practice. Take Iraq and Ethiopia which both have the same severity of 4.6. Iraq received $466m, and Ethiopia $1664m.
Other cases that don’t fit the pattern are Jordan, Turkey, Lebanon and Bangladesh (all with a “high” severity). All of these received at least $600m in 2021, and we can’t help but noticing that 3 of these 4 are countries affected by the Syrian refugee crisis. This goes to show that severity isn’t necessarily the only consideration. Perhaps large refugee populations are another key consideration.
On the whole, however, if a context has a very high severity then it tends to have more funding. But, otherwise the relationship between severity and funding is a lot weaker.
Does higher severity lead to enough funding?
As we said earlier, more funding does not mean enough funding. Absolute dollars is what donors and partners deal in. But from the perspective of affected populations, budgets and dollars don’t mean much if it doesn’t translate into actual humanitarian services. We could have really high amounts of funding, but it still not be enough due to the cost of activities or scale of the crisis.
We can calculate how much is “enough” funding by looking at (a) how much funding is given compared to (b) what is needed (funding requirement). This gives us a % of funding requirement met (e.g. $400m of $1bn was received = 40% met). The below graph shows us how funded or underfunded contexts are when we consider how much is needed.
As the graph shows us, higher severity doesn’t necessarily equal enough funding. There is absolutely no correlation between severity and having enough funding to deal with humanitarian crises.
However, we can say that none of the very high severity contexts are chronically underfunded (under 25%). Aside from this, we can’t say that the severity of a crisis leads to enough funding for that crisis, maybe just more funding.
Obviously, the best thing would be that all crises are 100% funded, but that’s not realistic in a climate of rising humanitarian needs that are accelerating faster than funding. Therefore, we’re stuck asking the question whether the lack of association between severity and enough funding is a good or bad thing?
For what it’s worth, we think it’s a good thing that crises that are less severe also stand a chance of getting enough funding. But those arguing against would say that it is a bad thing that crises that are more severe don’t get enough funding which is distributed elsewhere on the severity scale. True. But the answer to this is not to redistribute funding away from overlooked and forgotten crises. The answer is to double down on advocacy and fundraising, and get enough funding to very high severity crises, whilst also ensuring that less severe crises get a bite of the cherry.
Methodology and Sources
Caveat: We’ve chosen the word ‘associated with’ above as we’re not trying to prove causality, just show the relationship between the two. There be causation, but we can’t conclude anything by looking at correlations.
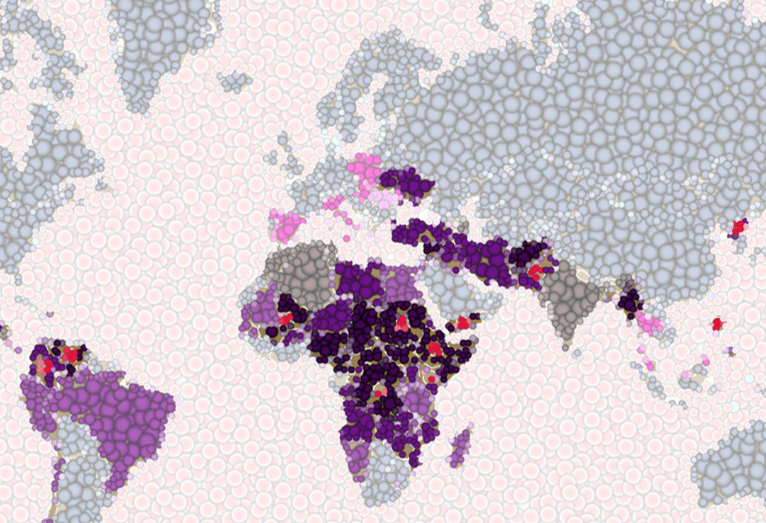
Cover Photo Credit: ACAPS Crisis InSight
Data Source – Severity: All severity data taken from ACAPS Inform Severity Index, and extracted via HDX via this page. As severity data is published monthly, and we are looking for a view across the year to match up with funding which is across the year of 2021, we have averaged the severity for each crisis across the year to come up with a severity score that reflects severity across the whole of 2021. In the first analysis (“more funding”), the severity score is the maximum of the severity in a country. For example, Mozambique has two crises (“Complex Crisis” and “Cabo Delgado Islamist Insurgency”), and the maximum severity of these two crises was taken for Mozambique. For the second analysis (“enough funding”), we have matched up specific crises on the INFORM Severity Index with specific response plan funding on FTS.
Data Source – Funding: All funding data was taken from the Financial Tracking Service and was extracted on 30th April 2020. In the first analysis (“more funding”), the funding value is reflective of all funding going to a country (inside and outside of respones plans). For the second analysis (“enough funding”), the funding value is reflective of funding going to a specific response plan in order that we can (a) get a sense of what enough funding looks like through % of funding requirement met, and (b) match it up with specific crises on the INFORM Severity Index.