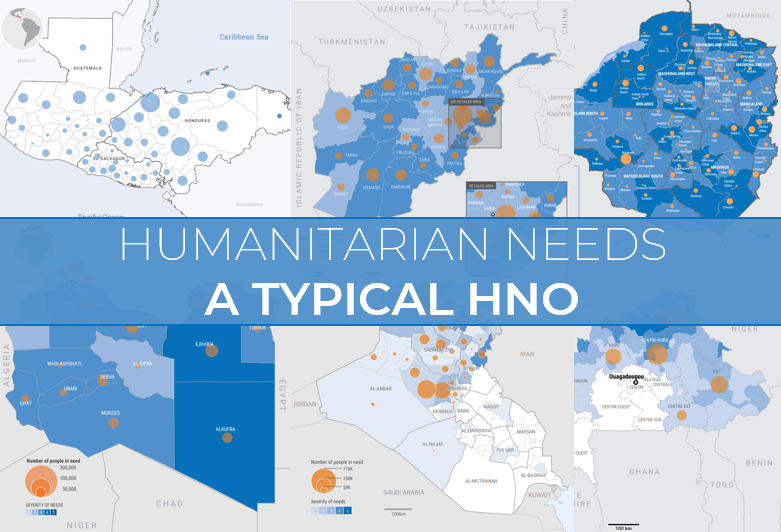
A Typical Humanitarian Needs Overview (HNO)7 min read
On this website we spend a lot of time talking about humanitarian funding – which makes sense given our name. But today we’ll talk about the people that the funding is intended for and ask: who are the “People in Need” (PIN) of humanitarian assistance? This information is usually contained in the Humanitarian Needs Overview (HNO) which is the document before the Humanitarian Response Plan (HRP). A HNO tells us what the needs are, and a HRP tells us how we’re going to respond to those needs.
We’ve done a review of the HNOs from 2021 and are summarising the key highlights here. In particular, across age, gender, and disability, what does a typical HNO look like, and who are normally the people in need of humanitarian assistance?
A couple of caveats before we get going. Firstly, we’re looking at only contexts with a Humanitarian Needs Overview, in other words contexts that are not refugee-focused (for more on the different types of humanitarian plans check out this story). Secondly, this is a review of the 2021 HNOs (mostly prepared in the last quarter of 2020) and reflects this year, not next. The next set of HNOs are being worked on and some of them are starting to be published.
Children typically account for 1 in every 2 people in need
Humanitarian crises are crises for children – children represent 50% of those in need in a typical HNO. This is followed by adults (46%), and then the elderly (4%). In fact, children represent more than 1 in 2 of those in need in over half of contexts that we have data on (15 of 28 HNOs).
The significant percentage of children in need of humanitarian assistance in a ‘typical case’ is striking and alarming. The decisions that humanitarian actors take have the power to shape the next generation in many contexts.
Many of the contexts with a lower percentage of children making up the total of those in need are contexts that have been through, or are at the tail end of the demographic transition. This is the case when looking at Ukraine, El Salvador, Colombia, Myanmar, Libya and Honduras. This isn’t necessarily surprising. The number and age structure of those in need is likely to be broadly reflective of the population as a whole.
Two contexts in particular stand out. At the one end, children account for 65% of those in need in Somalia – this reflects the fact that half of the population are under 17 years old. At the other end of the spectrum is Ukraine, where children account for 15% of those in need, and extraordinarily the elderly account for 37.5% of those in need. Why is it so different than other contexts? Again, it reflects the underlying age structure of the population. The median age in Ukraine is 41.2 years old.
Girls, Boys, Women and Men typically each account for about a quarter of those in need
This is a really easy thing to remember. If you’re thinking in the future, what percentage do men, or women, or girls, or boys typically account for of all those in need of humanitarian assistance: around 25% each. The world’s most boring pie chart below shows four roughly even segments reflecting this. And in terms of gender, women and girls typically account for 51%, whereas men and boys typically account for 49%. Simple enough to remember.
The vast majority of HNOs are like this. 21 of the 26 HNOs that detail this information have a gender split somewhere around 50-50, or within a 5% margin either side.
The second graph above, though, shows contexts where there is a ‘lean’ to a gender – in other words where one gender represents more than 55% of those in need. Four out of the five with a lean are contexts where women and girls represent more than 55%. But when you look at the share of the population that is female in these contexts, they are all between 50-52%. This suggests that in these contexts in particular, women and girls are disproportionately affected by humanitarian emergencies.
At the other end of the spectrum is Libya where around 6 in 10 of those in need are male. Yet the share of the population that is male in Libya is 49.5% – so why the difference between the two? A quick glance at their HNO shows that whilst the gender split is even for most population groups, it is predominantly male in two categories: migrants (89% male) and refugees (64%).
But these cases are outliers from the main pattern. There is generally an even gender split in the typical HNO.
Typically around 15% of those in need are people with disabilities
It is widely quoted that 15% of the world population lives with some form of disability. So why would the humanitarian sphere be any different? Well it’s not – persons with disabilities (PwD) account for 15% in a typical HNO of those in need of assistance. Of the 30 HNOs that have data on disability, 19 of them note that those with disabilities account for a figure between 14% and 16% of the total ‘People in Need’.
The clustering around the 15% mark reflects the global 15% estimate. But there are eight contexts where those with disability account for less than 10% of the total ‘in need’ population. We can’t think why there would necessarily be lower ‘local’ percentages in these contexts – could they be underestimates? Please leave your hypotheses in the comments box.
At the other end a staggering 25% of those in need of assistance in Syria live with a disability – that’s 3.3 million people.
Typical or atypical?
This is the second story in our ‘typical HNO and HRP’ series (check out the typical HRP here). And just like our analysis of HRPs, for HNOs there is a lot of variation between contexts. Atypical features of HNOs include: the high elderly population in Ukraine, the skewed gender balance of those in need in five contexts, and the huge amount of those in need in Syria that live with some form of disability.
But on the whole, we can make some generalisations for HNOs (read: non-refugee humanitarian crises): children are hugely affected (1 in 2 of those in need), the split between women, girls, men, and boys is equal (1 in 4 of those in need each), and persons with disabilities account for around 15% of those in need of assistance (around the global estimate).
Methodology and Sources
Source: A review of the 2021 HPC documents was undertaken to write this story. Figures are taken from the HNO, and cross-referenced with the figures in the HRP and data on HDX. Where the HNO does not have a figure for either age, gender, or disability, figures were sourced from the two other sources noted above. Figures were found across 30 contexts for persons with disabilities. 28 contexts noted figures for age. 26 contexts noted figures by gender/age.
The contexts analysed in this story are: Afghanistan, Burkina Faso, Burundi, Cameroon, Central African Republic, Chad, Colombia, Democratic Republic of Congo, El Salvador, Ethiopia, Guatemala, Haiti, Honduras, Iraq, Libya, Mali, Mozambique, Myanmar, Niger, Nigeria, oPt, Pakistan, Somalia, South Sudan, Sudan, Syria, Ukraine, Venezuela, Yemen, Zimbabwe
Age charts: the “typical” graph reflects the median value (rounded) across all 28 contexts that we have data for. It is important to note that the age categories differ by response plan. For example, the Afghanistan HNO defines children as between 0 and 17 years old, whereas the Chad HNO defines children as between 0 and 14 years old.
Gender charts: the “typical” graph reflects the median value for each category across all 26 contexts that we have data for. The sum of this is 99.6%, however, and this would make for a rather incomplete pie chart. For presentation purposes we have scaled the percentages of each category so that the sum across all categories equals 100%. The difference is extremely marginal and doesn’t detract from the key message of a typical 50-50 split between female and male people in need.
Disability charts: the 15% ‘typical’ figure reflects the median value across all 30 contexts that we have data for.